Current page
Pioneer of electronic ticket-based live streaming "ZAIKO" releases market research results on online live streaming - The spread of paid live streaming has significantly transformed consumer purchasing behavior and viewing experiences.
News

ZAIKO Corporation (Headquarters: Minato-ku, Tokyo, Representative Director: Malek Nasser), which provides an electronic ticket sales platform, has released the results of a market research survey regarding online live streaming targeting ZAIKO users during the pandemic period (from March to August 2020).
■ Main Research Findings
This survey revealed that the most common device used for purchasing and viewing live streaming tickets is the “smartphone,” and that purchases made through Twitter are the highest. Furthermore, while 60% of purchases occur the day before the event, over 30% are made on the day of the event.
■ Background for Releasing the Research Results
Until now, most data concerning live ticket purchasers was owned by each ticket agency, preventing event organizers from utilizing this data. However, ZAIKO provides all customer data excluding personal information to event organizers. This enables event organizers to analyze user attributes and preferences and use this information for marketing purposes. Additionally, by utilizing customer data, event organizers can communicate directly with users and use CRM (Customer Relationship Management) tools to announce upcoming events and distribute sponsored content.
In this release, ZAIKO presents the actual conditions, intentions, and challenges of users utilizing live streaming. Not only for artists and event organizers currently utilizing live streams, but also for those considering future implementations, we aim for them to utilize this research outcome and the user data obtainable through ZAIKO to contribute to the live entertainment industry. ZAIKO will continue to develop services that support artists and event organizers.
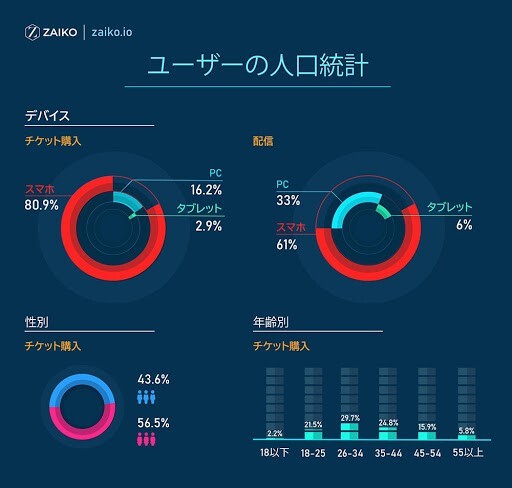
Figure 1: User Demographics
■ Detailed Findings: User Demographics The majority of users purchase and view live streaming tickets using convenient smartphones
Looking at the demographics of ZAIKO users (Figure 1), the results show that smartphones (80%) are used overwhelmingly more than PCs (16%), which came in second for purchasing live streams. However, in terms of devices used for viewing, smartphones top the list at 61%, with their popularity stemming from being unbound by viewing locations, but it was noted that PCs also comprise 31% as the second most-used device, indicating that a significant number of users switch between multiple devices for purchasing and viewing.
Additionally, the gender ratio indicates that slightly more women are involved, and regarding age, those in their late 20s to early 30s watch live streams the most, closely followed by users in their late 30s to early 40s.
Devices Used for Purchasing Live Streaming Tickets:
1st place Smartphone (80.9%)
2nd place PC (16.2%)
3rd place Tablet (2.9%)
Devices Used for Viewing Live Streaming:
1st place Smartphone (61.2%)
2nd place PC (31.8%)
3rd place Tablet (7.0%)
Demographics of Users Who Watched Live Streaming on ZAIKO:
● Gender: Female 56.5% Male 43.6%
● Age: 1st place 26 to 34 years old (29.7%);
2nd place 35 to 44 years old (24.8%);
3rd place 18 to 25 years old (21.5%);
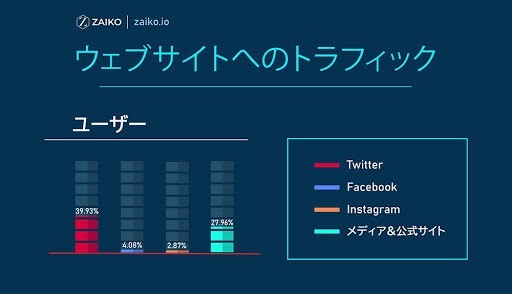
Figure 2: Traffic to the Website
■ Detailed Findings: Ticket Purchase Path
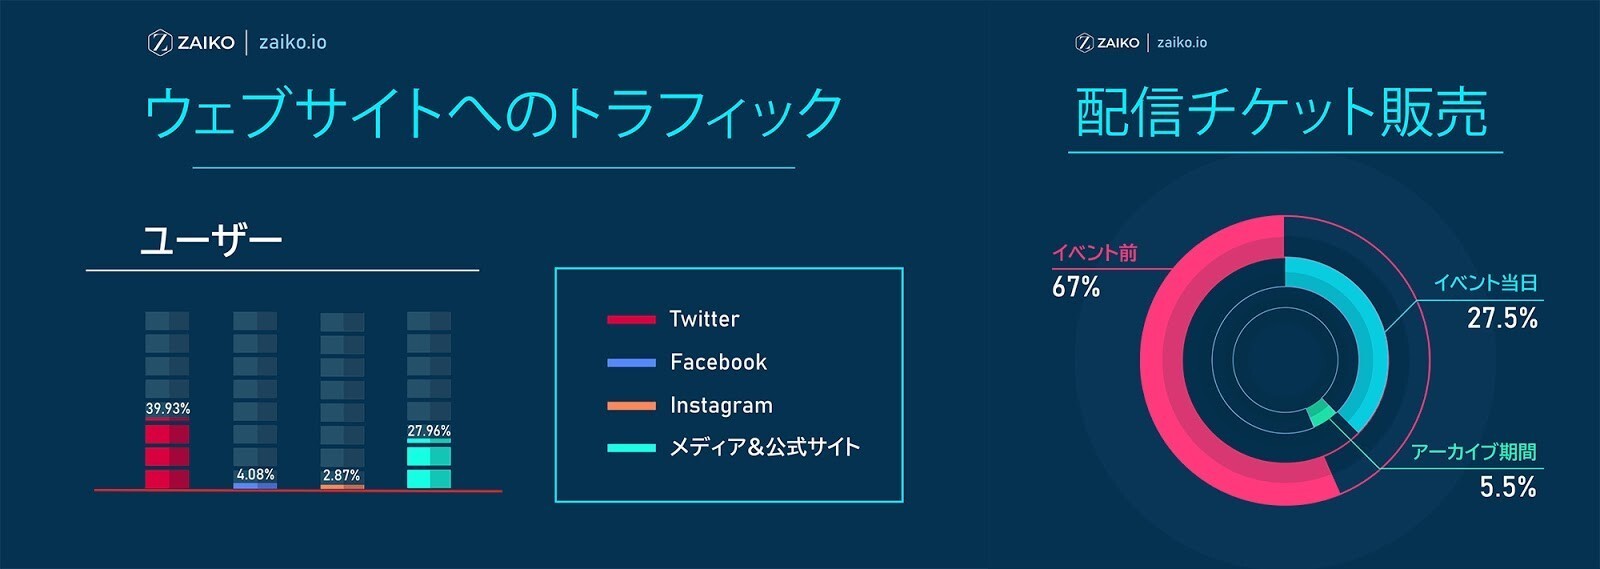
The influx from Twitter is overwhelmingly the highest
An investigation into the percentage of users visiting ZAIKO (Figure 2) showed that the influx from social media is predominantly high, with around 40% of users coming through Twitter, indicating that fresh information disseminated by artists significantly influences the actions of core fans, pointing to a distinct shift from past promotional methods by ticket agencies relying on newsletters to one of direct communication occurring between artists and fans, which shapes user purchasing behavior in a remarkably different way.
Website Traffic:
1st place Twitter (39.93%)
2nd place Media & Official Site (27.96%)
3rd place Facebook (4.08%)
4th place Instagram (2.87%)
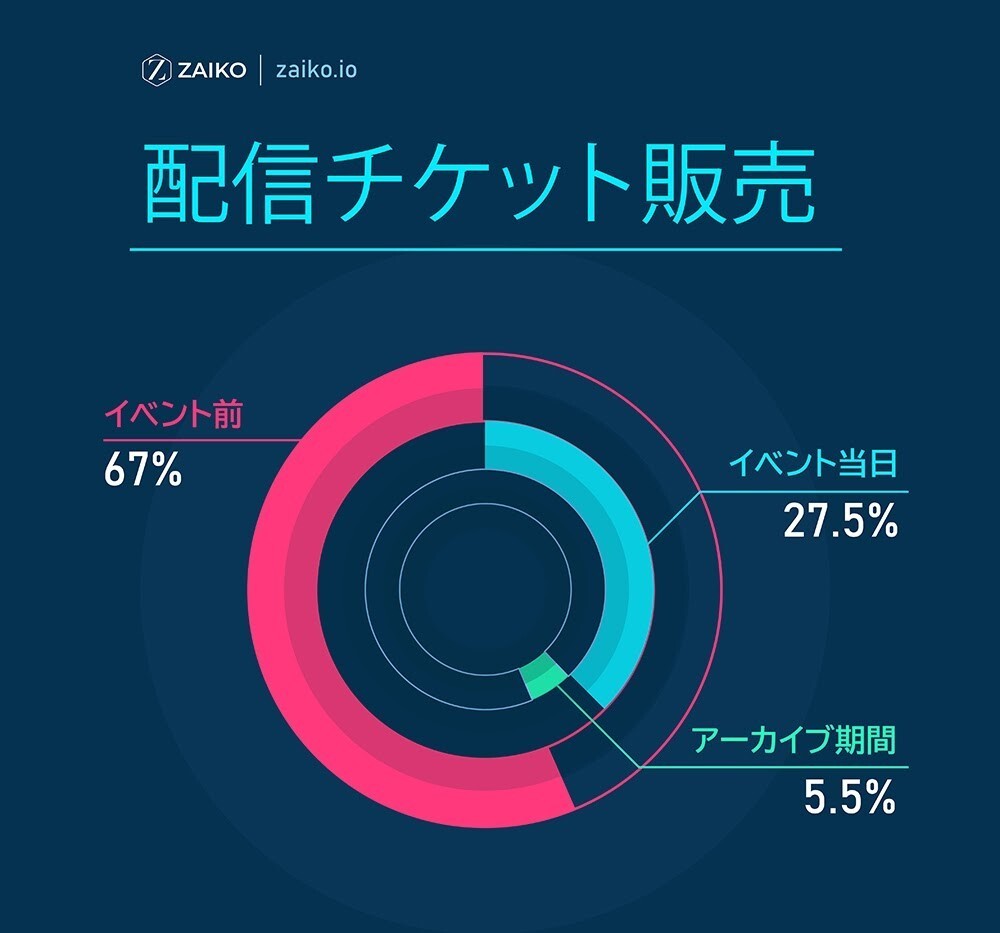
Figure 3: Timing of Ticket Purchases
■ Detailed Findings: Timing of Streaming Ticket Purchases
The percentage of tickets purchased on the day is 30%, and those for archive viewing are about 5%
In the past, most live events were purchased in advance as pre-sale tickets, but with the absence of ticket limits for paid live streaming, the proportion of users purchasing tickets on the day of the event (as shown in Figure 3) has increased.
Additionally, with the rise of smartphone usage, the number of social media users has significantly increased, resulting in an overwhelming increase in the amount of information users can obtain, leading to an unconscious sorting of information, where individuals now consume only things they deem necessary or wish to experience, which is considered one reason for the increasing proportion of same-day ticket purchasers.
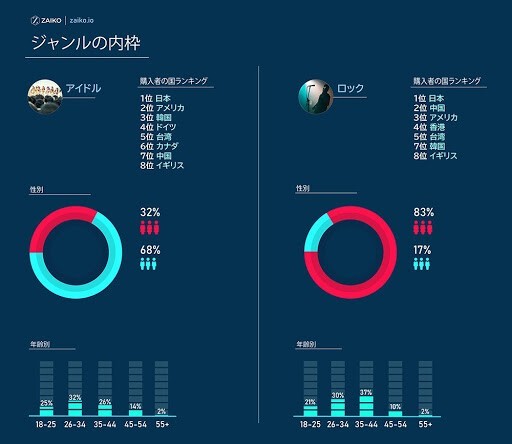
Figure 4: Breakdown of Viewing Genres
■ Detailed Findings: Genres of Live Streaming Viewing
The rock genre enjoys significant support from women in Asia
Looking at the breakdown of genres in live streaming events, American audiences rank second in idol live streaming, followed by Japan and third place in Korea, while in the rock genre, second place goes to China, third to America, and viewers from Hong Kong, Taiwan, and Korea make up significant portions ranked fourth through sixth. The gender ratio shows that 68% of idol viewers are male, whereas 83% of rock viewers are female, indicating high support for the rock genre from women in the Asian region.
Additionally, the characteristics of users in each artist category (Figure 4) are as follows:
・ Idol:
・68% of viewers are male.
・The age range most viewing is 26 to 34 years old.
・ Rock:
・The gender ratio is overwhelmingly dominated by females at 83%.
・In terms of age, nearly 90% (88%) of users viewing are below their early 40s.
・There is high interest in viewership from the Asian region internationally.
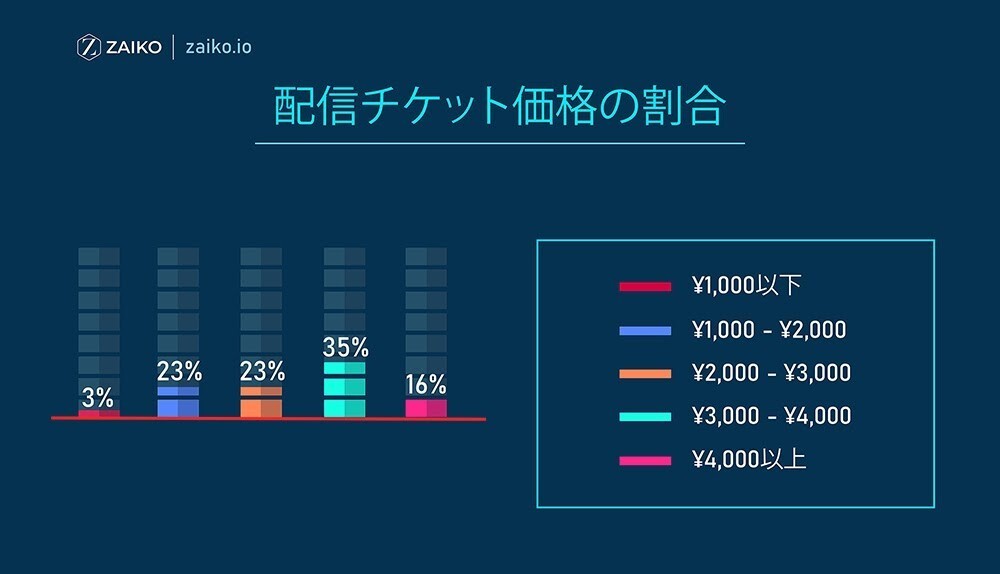
Figure 5: Percentage of Ticket Prices
■ Detailed Findings: Ticket Prices and Timing of Purchase
The most common price range of live tickets is between 3,000 yen and 4,000 yen, accounting for 35% of total sales
The research on ticket prices for live streaming (Figure 5) revealed that tickets in the 3,000 to 4,000 yen range are the most sold. Initially, when paid live streaming began, tickets priced between 1,000 and 2,000 yen were relatively common compared to real live events, but due to the prolonged coronavirus problem, major artists have increasingly hosted paid live streaming events, thus driving up the unit price of tickets. It is understood that these ticket prices are entering the range established among entertainment fans since March 2020.
As this research illustrates, rapid changes during the pandemic have significantly altered consumer purchasing behavior and viewing experiences. Even as the world returns to a state where real events can gradually resume, the demand for features unique to digital—such as archiving of events, features allowing direct communication between artists and fans, and the ability to participate in live performances from anywhere in the world—are expected to persist in varied forms. Thus, users will have the option to choose between real live events and live streaming, including associated viewing costs, leading to a dual revenue stream from a blend of real and digital experiences, which will drive expansion in the live entertainment market.
More articles

ZAIKO and AppBank Inc. Begin Collaboration to Maximize Event Value by Leveraging Corporate Networks
ZAIKO and AppBank Inc. Begin Collaboration to Maximize Event Value by Leveraging Corporate Networks
ニュース

Fan Meeting & Fortune-Telling Sessions with Korea's Most Popular Fortune Tellers Noh Seul Bi and Meta Jun — Stars of the Hit Reality Show "Battle of Fates" — Coming to Hong Kong for the First Time!
Fan Meeting & Fortune-Telling Sessions with Korea's Most Popular Fortune Tellers Noh Seul Bi and Meta Jun — Stars of the Hit Reality Show "Battle of Fates" — Coming to Hong Kong for the First Time!
ニュース

Our Representative Director, Shimada, spoke at Music Ally Japan Connect 2026. 🎤
Our Representative Director, Shimada, spoke at Music Ally Japan Connect 2026. 🎤
ニュース